Definition of Performance Monitor in Network Encyclopedia.
What is Performance Monitor?
Performance Monitor is a system tool for monitoring the performance of a Microsoft operating system. (In Windows 9x, Windows 2000, and Windows XP this tool is called System Monitor.)

This type of application may be used to determine the cause of problems on a local or remote computer by measuring the performance of hardware, software services, and applications.
You can use Performance Monitor to:
- Capture real-time performance objects and counters
- Log, graph, and set alert conditions for performance data
- Identify bottlenecks and trends in resource usage
- Observe the effect of system configuration changes
- Establish a baseline and determine system capacity
How Performance Monitor works
When you use Performance Monitor, you should collect data on the four main system resources (the memory, processor, disk, and network subsystems) in addition to resources specific to the aspect of server usage you are studying. The following table shows the recommended objects to monitor.
Recommended Objects to Monitor
| System Resource | Performance Objects to Monitor |
| Memory | Memory, cache |
| Processor | Processor, system |
| Disk | Logical disk, physical disk |
| Network | Network segment, network interface, server |
Performance Monitor in Windows Server
To start Performance Monitor press the Windows key, type “perfmon,” and then click Performance Monitor. The executable file is located under the Windows directory at %windir%\system32\perfmon.exe where %windir% is the environment variable indicating where the operating system is installed. This means that Perfmon can be started from any command prompt or address bar by simply typing in “Perfmon” and pressing Enter.
Using Performance Monitor
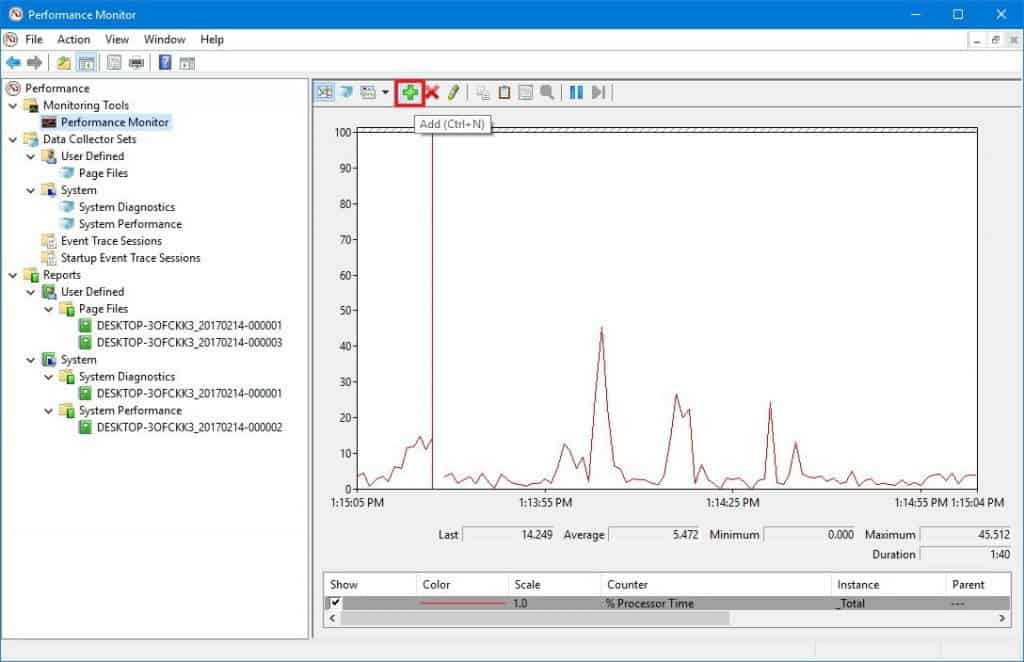
On the left, there is the navigation pane with access to Performance Monitor, Data Collector Sets, and Reports.
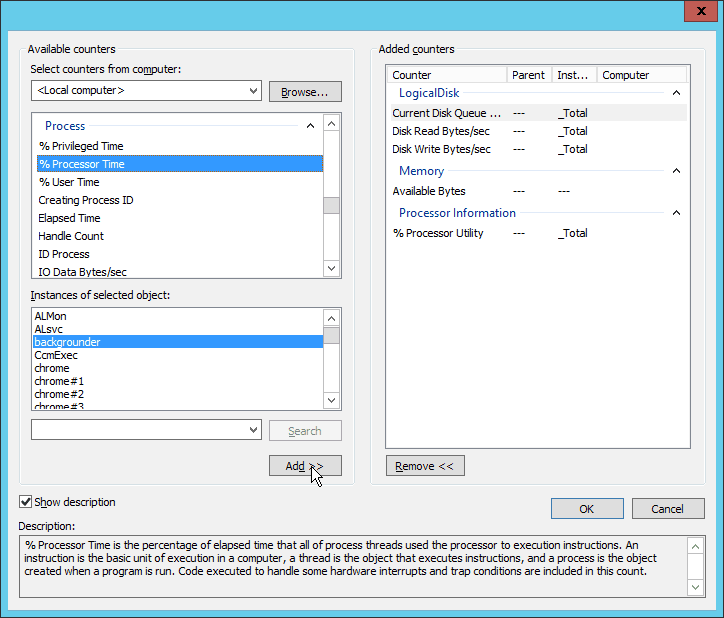
By default, the Performance Monitor starts off with one data measurement: Processor Time. This shows what percentage of your CPU’s maximum power is being used on a moment-to-moment basis, or in other words, how hard it’s working at any given moment. But you can monitor hundreds of other stats on your system if you want to. The Performance Monitor allows you to add and remove “counters” to the board (a counter is just another word for “stuff you want to monitor”).
What should you monitor?
- Memory | % Committed Bytes in Use: Tracks what percentage of your RAM is currently committed (“in use”). This should fluctuate as apps are opened and closed, but if it steadily increases, it could indicate a memory leak.
- Network Interface | Bytes Total/sec: Tracks how many bytes are sent and received over a particular network interface (such as Wi-Fi or Ethernet). If this ever gets above 70% of an interface’s bandwidth, you should consider upgrading.
- Paging File | % Usage: Tracks how much of your system’s paging file is being used. If this is consistently high, you should consider increasing your physical RAM or at least increase the size of your paging file.
- Physical Disk | % Disk Time: Tracks how much of the hard drive’s time is spent handling read and/or write requests. If this is consistently high, you should consider upgrading to a solid-state drive.
- Physical Disk | % Disk Read Time: Same as above except only for read requests.
- Physical Disk | % Disk Write Time: Same as above except only for write requests.
- Processor | % Interrupt Time: Tracks how much time is spent by your CPU handling hardware interrupts. If this is consistently above 10-20%, it could indicate a potential issue in one of your hardware components.
- Thread | % Processor Time: Tracks how much of your processor’s capabilities are being used by an individual process thread (an app could have multiple threads). Only useful if you can identify which thread to monitor.
Creating a new data collector set
- In the left pane, click Data Collector Sets.
- In the right pane, right-click User Defined, click New, and then click Data Collector Set.
- In the Create new Data Collector Set wizard, enter a name for the data collector set. For example, you might enter Tableau Server Performance.
- Select Create manually (Advanced) and then click Next.
- Under Create data logs, select Performance counter, and click Next.
Select performance counters.
- Set the sample interval to 30 seconds and click Add.
- Select performance counters from the list.
- Under Instances of selected object, if appropriate, select the process (or instance) that you want to collect information about. Click Add, Ok and Next.

Save the data collector set.
- Browse to the folder where you want to store the data, and then click Next and Finish.