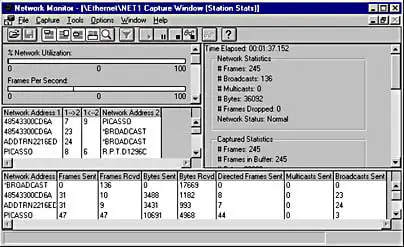
Microsoft Network Monitor was a Windows administrative tool that functioned as a software-based network packet analyzer for troubleshooting network problems. You can use Network Monitor to:
- Capture data frames from a connected network
- Display, filter, edit, and retransmit frames on the network
- Monitor and display protocol statistics
- Examine individual captured frames in detail
Index
- History
- Collecting data with Network Monitor
- Download the latest Microsoft Network Monitor 3.4 2350 (6/24/2010)
Network Monitor History
The LAN Manager development team had one shared hardware-based analyzer at the time. Netmon was conceived when the hardware analyzer was taken during a test to reproduce a networking bug, and the first Windows prototype was coded over the Christmas holiday. The first 4 bytes of the Netmon capture file format were used to validate the file. The values were ‘RTSS’ for Ray, Tom, Steve, and Steve – the first four members of the team. The code was originally written for OS/2 and had no user interface; a symbol was placed in the device driver where the packet buffers were kept so received data could be dumped in hex from within the kernel debugger.
Netmon caused a bit of a stir for Microsoft IT since networks and e-mail were not encrypted at the time. Only a few software engineers had access to hardware analyzers due to their cost, but with Netmon many engineers around the company had access to network traffic for free. At the request of Microsoft IT, two simple identification features were added – a non-cryptographic password and an identification protocol named the Bloodhound-Oriented Network Entity (BONE) (created and named by Raymond Patch as a play on the codename Bloodhound).
Collecting data with Network Monitor
When you install Network Monitor, it installs its driver and hooks it to all the network adapters installed on the device. You can see the same on the adapter properties, as shown in the following image.
When the driver gets hooked to the network interface card (NIC) during installation, the NIC is reinitialized, which might cause a brief network glitch.
To capture traffic
- Run netmon in an elevated status by choosing Run as Administrator.
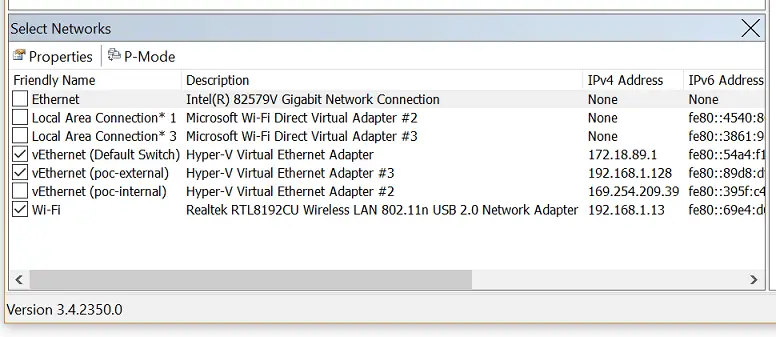
- Network Monitor opens with all network adapters displayed. Select the network adapters where you want to capture traffic, click New Capture, and then click Start.
- Reproduce the issue, and you will see that Network Monitor grabs the packets on the wire.
- Select Stop, and go to File > Save as to save the results. By default, the file will be saved as a “.cap” file.
The saved file has captured all the traffic that is flowing to and from the selected network adapters on the local computer. However, your interest is only to look into the traffic/packets that are related to the specific connectivity problem you are facing. So you will need to filter the network capture to see only the related traffic.
Commonly used filters
- Ipv4.address==”client ip” and ipv4.address==”server ip”
- Tcp.port==
- Udp.port==
- Icmp
- Arp
- Property.tcpretranmits
- Property.tcprequestfastretransmits
- Tcp.flags.syn==1
Download the latest Microsoft Network Monitor 3.4 2350 (6/24/2010)
Network Monitor 3.4 is the archived version protocol analyzer and is no longer under development. It was replaced by Microsoft Message Analyzer. Microsoft Message Analyzer supports the latest protocol parsers for capturing, displaying, and analyzing protocol messaging traffic, events, and other system or application messages in troubleshooting and diagnostic scenarios. It is a significantly more powerful tool for capturing and analyzing protocol messages.